Understanding Cooling Degree Days (CDD) and Their Changes Over Turkey
- Çağrı Karaman
- Jan 4, 2025
- 3 min read
Updated: Jan 7, 2025
What Are Cooling Degree Days (CDD)?
Cooling Degree Days (CDD) are a measure used to estimate the energy demand for cooling buildings. CDD is calculated as the sum of daily temperatures exceeding a baseline temperature, typically 18°C, across a specific time period. It provides an indication of the heat accumulation during warm periods and is widely used in energy planning, climate studies, and economic assessments related to air conditioning usage.
Why Are CDD Important?
CDD plays a crucial role in understanding:
Energy Demand: As CDD increases, so does the demand for electricity and other energy resources to cool homes, offices, and public spaces.
Economic Impacts: Higher energy consumption leads to increased costs for individuals and governments.
Climate Change Indicators: CDD is a valuable metric for tracking how rising temperatures influence energy needs and comfort levels in urban and rural areas.
Changes in CDD Over Turkey
Turkey, with its diverse climate zones ranging from Mediterranean to continental, has experienced significant changes in CDD over the years. These changes are largely attributed to global warming and shifts in regional climate patterns.
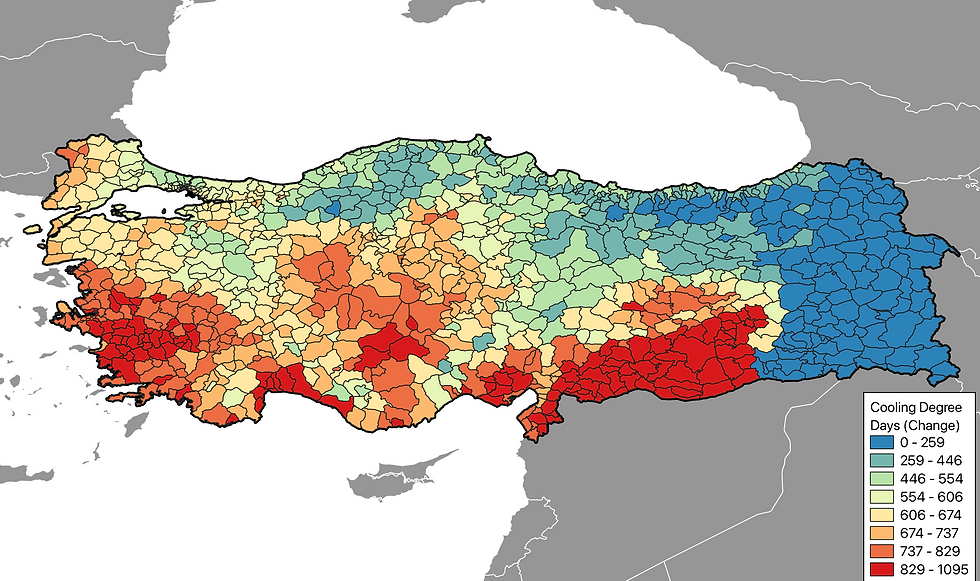
Visualizing the CDD Changes
To better understand these changes, we have prepared a CDD change map of Turkey using our own high-accuracy and high-resolution climate projections. These projections combine outputs from 34 different climate models with bias correction and downscaling applied using advanced machine learning techniques. Here, we present the multi-model ensemble median of all model outputs, providing a robust and reliable representation of CDD changes for SSP585 scenario.
The map represents the mean CDD changes for the period 2060-2080. The reference period is selected as 1980-2010, and changes were calculated accordingly.

Additionally, we analyzed CDD changes for each city to identify regions most affected by increasing temperatures.
Key Observations from the CDD Map
Regions with the Highest Increases:
The data indicates that Şanlıurfa experiences the largest increase in CDD (+1029), highlighting its status as a major hotspot for cooling demand in the future.
Cities like Kilis (+964), Gaziantep (+952), Adıyaman (+909), and Aydın (+868) follow closely, showing significant rises in cooling needs.
Regional Variability:
Western Turkey, particularly in the Aegean and Mediterranean regions, exhibits sharp increases, reflecting the already warm climate and exacerbation due to climate change.
Southeastern cities such as Şanlıurfa, Kilis, and Gaziantep are also highly impacted, with their traditionally hot climates becoming even more intense.
Moderate Changes:
Southeastern cities such as Şanlıurfa, Kilis, and Gaziantep are also highly impacted, with their traditionally hot climates becoming even more intense.
Cooling Degree Days change (2060-2080) in cities with respect to reference period (1980-2010)
City-Level Highlights
City | CDD Change |
Şanlıurfa | +1029 |
Kilis | +964 |
Gaziantep | +952 |
Adıyaman | +909 |
Aydın | +868 |
Hatay | +842 |
Diyarbakır | +814 |
Izmir | +810 |
Muğla | +796 |
Manisa | +795 |
Denizli | +774 |
Aksaray | +772 |
Implications of Rising CDD
Energy Infrastructure:
There is a pressing need to upgrade energy infrastructure to meet the rising cooling demands.
Economic Costs:
Increased energy consumption will strain household budgets and government resources.
Adaptation Measures:
Promoting energy-efficient cooling systems and renewable energy sources can mitigate some of the impacts.
Urban planning strategies, such as increasing green spaces, can help reduce urban heat.
Conclusion
The increasing CDD over Turkey highlights the urgent need for adaptive measures in energy planning and urban development. Cities like Şanlıurfa, Kilis, and Gaziantep are leading in CDD increases, signaling regions where action is most critical. By focusing on the most affected regions and cities, policymakers and stakeholders can prioritize investments in sustainable cooling solutions and climate resilience strategies.
Map and Data Insights
Below is the mean CDD change of Turkey considering historical (1950-2014) and future periods (2015-2100) for SSP245 and SSP585 scenarios.
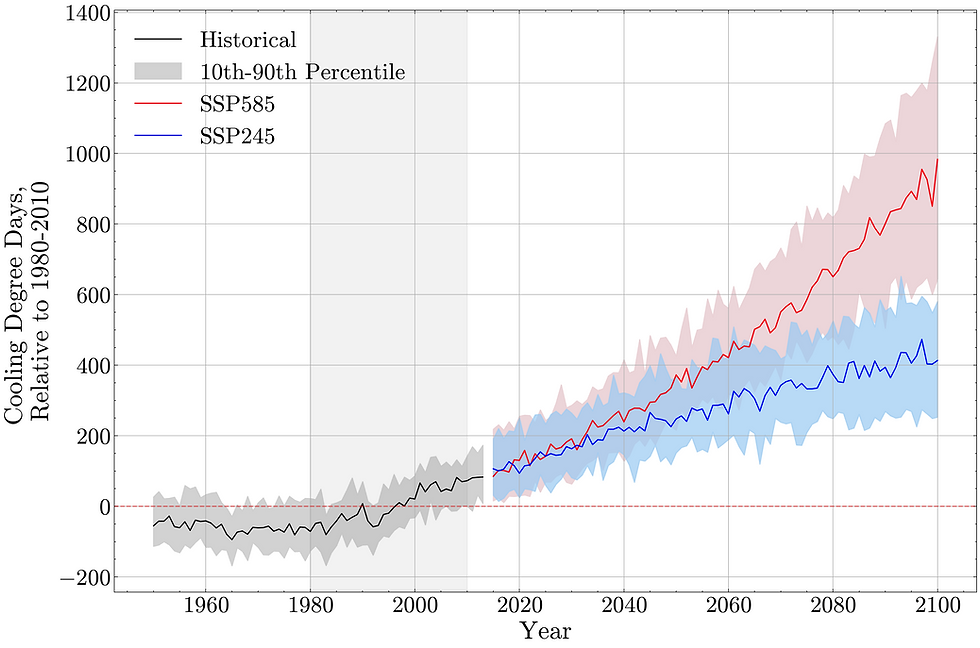
Under the SSP245 scenario (moderate emissions), there is a gradual increase in CDDs starting around 2020. By 2100, the projected increase reaches approximately 800 relative to the baseline.
In the SSP585 scenario (high emissions), the increase in CDDs is much more pronounced. By 2100, CDDs are projected to rise to around 1200 relative to the baseline. The rate of increase accelerates significantly after 2040, and the uncertainty range is broader compared to SSP245
These insights underscore the uneven impacts of climate change across Turkey and the importance of targeted solutions to address energy and environmental challenges.

Kabar4d Amazon Reseller: Event Gila Fruit Party 2 Cuan Maksimal .